The website FiveThirtyEight.com prides itself on knowing Numbers, with a large portion of the posts relating to statistics in some way, though it also publishes a large amount of Social Justice Warrior material, often Number-related. For example, there is Hayley Munguia’s hilariously titled article “Transgender Students Are Particularly Vulnerable To Campus Sexual Assault.” You can’t make this stuff up.
People like Numbers, now more than ever with the importance of technology and computers. Ideologues love to point to Numbers and say proof! But most people don’t like thinking hard about Numbers, which is why they will fall for the occasional nonsense chart. They are going to be particularly vulnerable to this if it involves a subject which they habitually practice crimestop when thinking about, such as race.
FiveThirtyEight recently published a particularly flawed piece by Hayley Munguia, titled “Here’s What Happens When You Ban Affirmative Action In College Admissions.” Munguia purports to show that banning affirmative action hurts enrollment of Blacks and Hispanics. She shows two charts:
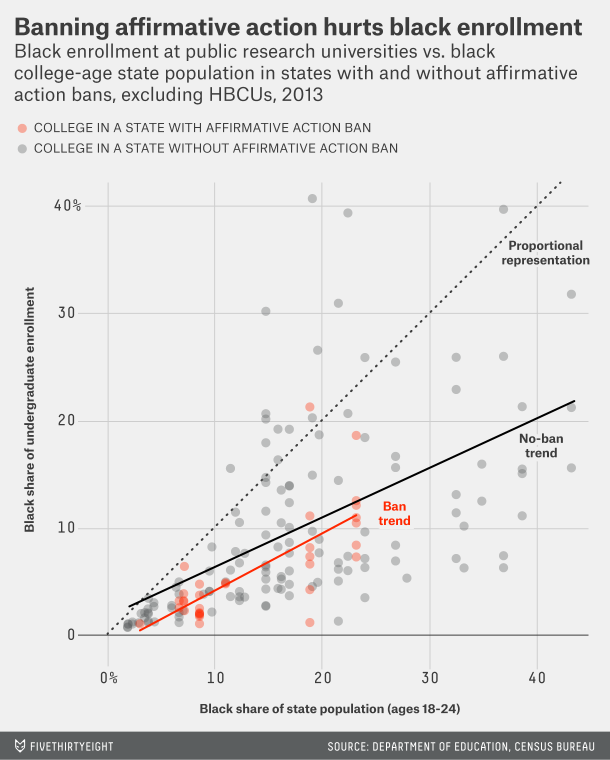
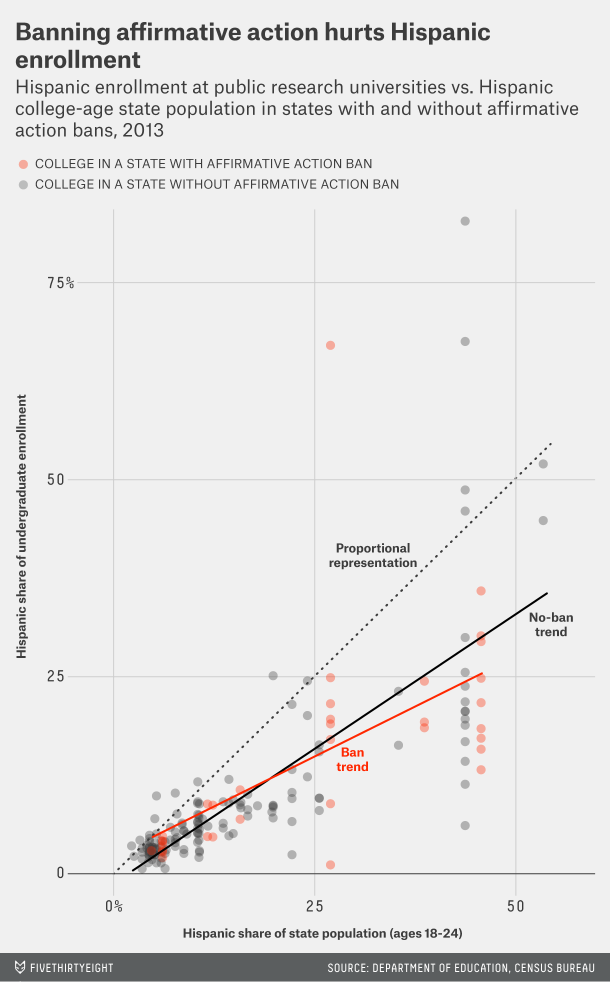
Significance tests? P values? If Munguia calculated them she kept them to herself. It’s especially amazing that she concluded that “banning affirmative action hurts Hispanic enrollment” on the basis of hardly any difference at all. There’s another problem: Munguia performed a linear regression, yet she has no reason to assume the data should follow a linear pattern. If Group A is 4% of the population and 2% of enrollment, that’s quite a bit of underepresentation. If the same group is 25% of the population and 23% of enrollment that’s hardly any underepresentation. The real way to do comparisons of group representation is ((group representation)/(group percentage))/((1-group representation)/(1-group percentage)).
I found the data for racial percentages at public research universities, excluding HBCUs, here and data for the racial percentages of state populations here, I reproduced the data here. Based on the data I made my own calculation of the difference in under-representation between the states which ban affirmative action and those which don’t. I found a statistically significant difference in under-representation for Blacks(p value = .032). There is no difference in under representation for Hispanics(p value = .454)
Note that absence of evidence is not evidence of absence, I am not saying that affirmative action bans do not impact Hispanic enrollment, just that the data do not show a statistically significant difference. Note also that the difference(or lack thereof) in under-representation between the states which ban affirmative action and those which don’t might be explained by other factors. Florida’s Hispanics, for example, are very different from New York’s.
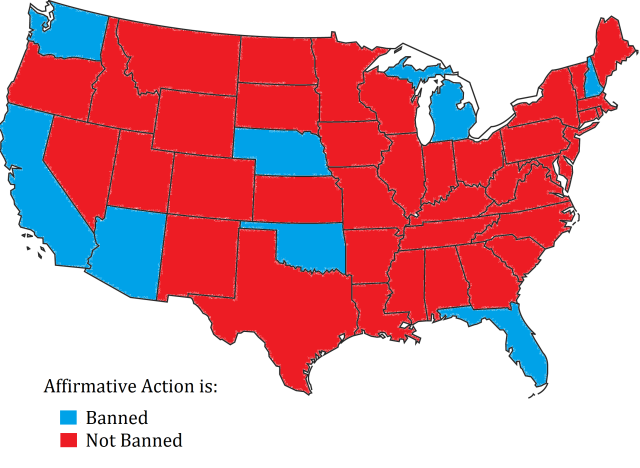
I’m unconvinced that banning affirmative action in the current environment is a good idea. The current elite is solidly supportive of “Diversity” and this includss the GOP’s elite, note the non-correlation between red on the affirmative action map and red on election maps. So when affirmative action is banned, the result is often simply to ignore it, or, even worse, to adopt “non-discriminatory” measures to achieve the same results. The most infamous is Texas’s “10 percent rule,” automatically admitting anyone in the top 10 percent of their high school class. This strikes me as being far worse than outright affirmative action since it is so unmeritocratic, but cuckservatives congratulate themselves on their support of both non-discrimination and diversity.
It’s likely that either Mungia herself(who is a “datablogger”) or the FiveThirtyEight editors(they have editors, right?) noticed the analysis was flawed. After it was published a few commenters pointed out the lack of r^2 and p values, though most simply condemned or defended affirmative action. I think it is likely that FiveThirtyEight knows but doesn’t care because why should they care? Publish. Get linked. Get clicks. Get more Viewers. Who cares if a very small fraction of them notice the analysis is flawed? I thought of another, more sinister explanation. Network theorist Albert-László Barabási has joked that “there is a theorem in publishing that each graph halves a book’s audience,” but for clickbaity articles the opposite is true. Gotta have a graph or a map or a picture rather than just a bunch of words. Two graphs are better than two p values.
References
Hayley Mungia, Transgender Students Are Particularly Vulnerable To Campus Sexual Assault, FiveThirtyEight, September 12 2015 http://fivethirtyeight.com/datalab/transgender-students-are-particularly-vulnerable-to-campus-sexual-assault/
Hayley Mungia, Here’s What Happens When You Ban Affirmative Action In College Admissions, FiveThirtyEight, December 9 2015 http://fivethirtyeight.com/features/heres-what-happens-when-you-ban-affirmative-action-in-college-admissions/
IPEDs Data Center, National Center for Education Statistics, accessed December 2015 http://nces.ed.gov/ipeds/datacenter/
National Characteristics: Vintage 2013, US Census Bureau, accessed December 2015 https://www.census.gov/popest/data/national/asrh/2013/

Did you find any statistically significant difference in representation for Asian -Americans?
LikeLike
No.
LikeLike